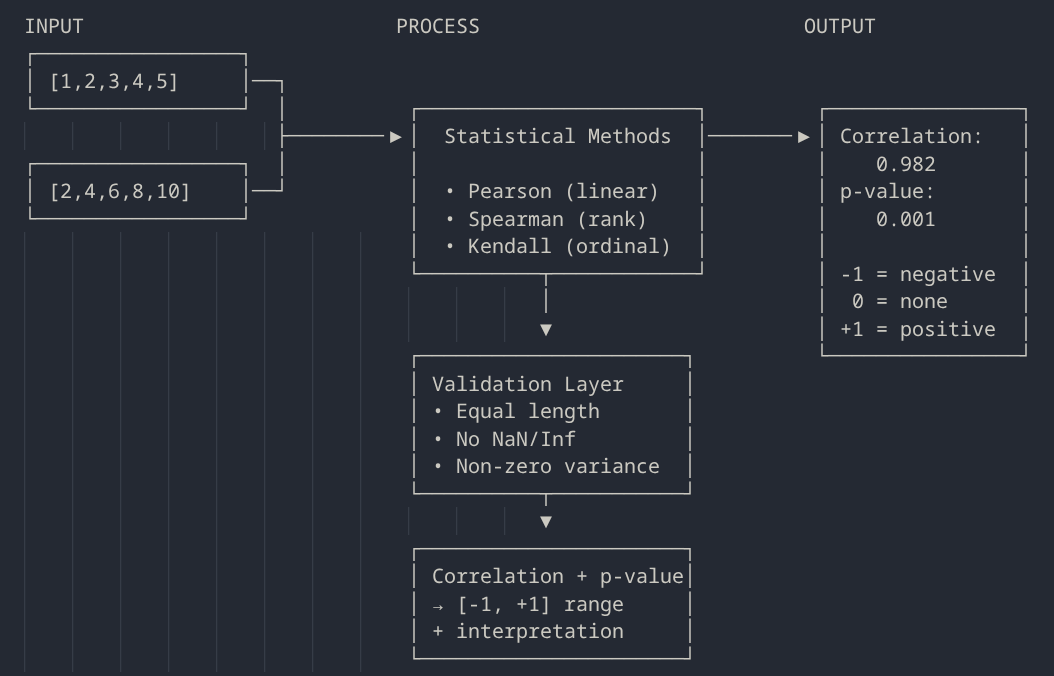
INPUT                          PROCESS                           OUTPUT
┌─────────────────┐
│ [1,2,3,4,5]     │──┐
└─────────────────┘  │          ┌───────────────────────┐         ┌────────────────┐
                     ├────────▶│  Statistical Methods  │───────▶│ Correlation:   │
┌─────────────────┐  │          │                       │         │    0.982       │
│ [2,4,6,8,10]    │──┘          │  • Pearson (linear)   │         │ p-value:       │
└─────────────────┘             │  • Spearman (rank)    │         │    0.001       │
                                │  • Kendall (ordinal)  │         │                │
                                └──────────┬────────────┘         │ -1 = negative  │
                                           │                      │  0 = none      │
                                           ▼                      │ +1 = positive  │
                                ┌──────────────────────┐          └────────────────┘
                                │ Validation Layer     │
                                │ • Equal length       │
                                │ • No NaN/Inf         │
                                │ • Non-zero variance  │
                                └──────────┬───────────┘
                                           ▼
                                ┌──────────────────────┐
                                │ Correlation + p-value│
                                │ → [-1, +1] range     │
                                │ + interpretation     │
                                └──────────────────────┘
Minimal API that calculates statistical correlation between any two numerical datasets. Built with Bottle (zero dependencies, 100KB) and SciPy’s proven statistical methods.
What it does: Send any two numerical arrays → get back correlation coefficient from -1 (perfect negative) to +1 (perfect positive), plus statistical significance (p-value). Works for stock prices, sensor data, A/B tests, scientific measurements - anything numerical.
Why multiple methods: Pearson detects linear relationships (parametric), Spearman handles monotonic/rank-based patterns (non-parametric), Kendall measures ordinal concordance. The API supports all three individually or simultaneously via method: "all".
Use cases: Portfolio diversification, feature selection for ML, A/B test analysis, scientific data correlation, time series relationships. Returns standardized [-1, +1] scores that integrate directly into any analytics pipeline.
Stack: ~150 lines, two endpoints (/api/correlate, /api/info), comprehensive validation (NaN, infinity, variance checks), automatic interpretation. Stateless design scales horizontally.
from bottle import post, get, run, request, response
import numpy as np
from scipy.stats import pearsonr, spearmanr, kendalltau

@post('/api/correlate')
def correlate():
    data = request.json
    values1 = data.get('values1', [])
    values2 = data.get('values2', [])
    method = data.get('method', 'pearson')

    if not values1 or not values2:
        response.status = 400
        return {'error': 'Both values1 and values2 are required'}

    if len(values1) != len(values2):
        response.status = 400
        return {'error': 'values1 and values2 must have the same length'}

    if len(values1) < 2:
        response.status = 400
        return {'error': 'At least 2 data points are required'}

    try:
        arr1 = np.array(values1, dtype=float)
        arr2 = np.array(values2, dtype=float)
    except (ValueError, TypeError):
        response.status = 400
        return {'error': 'values1 and values2 must contain valid numerical data'}

    if np.isnan(arr1).any() or np.isnan(arr2).any():
        response.status = 400
        return {'error': 'Data contains NaN values'}

    if np.isinf(arr1).any() or np.isinf(arr2).any():
        response.status = 400
        return {'error': 'Data contains infinite values'}

    if np.std(arr1) == 0 or np.std(arr2) == 0:
        response.status = 400
        return {'error': 'Data has zero variance (all values are identical)'}

    result = {
        'values1_count': len(values1),
        'values2_count': len(values2),
        'method': method
    }

    if method == 'pearson':
        corr, p_value = pearsonr(arr1, arr2)
        result['correlation'] = float(round(corr, 6))
        result['p_value'] = float(round(p_value, 6))
        result['interpretation'] = interpret_correlation(corr)

    elif method == 'spearman':
        corr, p_value = spearmanr(arr1, arr2)
        result['correlation'] = float(round(corr, 6))
        result['p_value'] = float(round(p_value, 6))
        result['interpretation'] = interpret_correlation(corr)

    elif method == 'kendall':
        corr, p_value = kendalltau(arr1, arr2)
        result['correlation'] = float(round(corr, 6))
        result['p_value'] = float(round(p_value, 6))
        result['interpretation'] = interpret_correlation(corr)

    elif method == 'all':
        pearson_corr, pearson_p = pearsonr(arr1, arr2)
        spearman_corr, spearman_p = spearmanr(arr1, arr2)
        kendall_corr, kendall_p = kendalltau(arr1, arr2)

        result['pearson'] = {
            'correlation': float(round(pearson_corr, 6)),
            'p_value': float(round(pearson_p, 6)),
            'interpretation': interpret_correlation(pearson_corr)
        }
        result['spearman'] = {
            'correlation': float(round(spearman_corr, 6)),
            'p_value': float(round(spearman_p, 6)),
            'interpretation': interpret_correlation(spearman_corr)
        }
        result['kendall'] = {
            'correlation': float(round(kendall_corr, 6)),
            'p_value': float(round(kendall_p, 6)),
            'interpretation': interpret_correlation(kendall_corr)
        }
    else:
        response.status = 400
        return {'error': f'Invalid method: {method}. Use pearson, spearman, kendall, or all'}

    return result

def interpret_correlation(corr):
    """Interpret correlation coefficient strength"""
    abs_corr = abs(corr)
    if abs_corr >= 0.9:
        strength = 'very strong'
    elif abs_corr >= 0.7:
        strength = 'strong'
    elif abs_corr >= 0.5:
        strength = 'moderate'
    elif abs_corr >= 0.3:
        strength = 'weak'
    else:
        strength = 'very weak'

    direction = 'positive' if corr > 0 else 'negative' if corr < 0 else 'none'
    return f'{strength} {direction} correlation' if direction != 'none' else 'no correlation'

@get('/api/info')
def info():
    """API metadata and capabilities"""
    return {
        'name': 'numerical-correlation-api',
        'version': '1.0.0',
        'description': 'Statistical correlation analysis for numerical datasets using Pearson, Spearman, and Kendall methods',
        'methods': {
            'pearson': 'Linear correlation between two continuous variables (parametric)',
            'spearman': 'Monotonic correlation using rank-based method (non-parametric)',
            'kendall': 'Ordinal correlation measuring concordance (non-parametric)',
            'all': 'Returns all three correlation methods simultaneously'
        },
        'correlation_range': [-1.0, 1.0],
        'interpretation': {
            '-1': 'perfect negative correlation',
            '0': 'no correlation',
            '+1': 'perfect positive correlation'
        },
        'use_cases': ['data-analysis', 'feature-selection', 'relationship-detection', 'time-series-analysis', 'multivariate-statistics'],
        'endpoints': ['/api/correlate', '/api/info'],
        'requirements': {
            'min_data_points': 2,
            'data_type': 'numerical arrays of equal length',
            'constraints': ['no NaN values', 'no infinite values', 'non-zero variance']
        }
    }

if __name__ == '__main__':
    run(host='0.0.0.0', port=5001, debug=True)
Classical statistics solves this problem perfectly - 70-year-old formulas beat modern ML for deterministic numerical relationships. No neural networks needed when Pearson’s formula is exact, instant, and interpretable.
Use Cases
-
Portfolio Management & Quantitative Finance
Correlation analysis is fundamental to Modern Portfolio Theory (MPT) and risk management.
- Portfolio diversification: Find assets with low/negative correlation to reduce risk
- Pairs trading: Identify highly correlated stocks for statistical arbitrage
- Beta calculation: Measure individual stock correlation with market indices (SPY, QQQ)
- Sector analysis: Understand how stocks correlate within and across sectors
- Risk assessment: Calculate correlation matrices for VaR models
-
Machine Learning Feature Selection
Remove redundant features and identify multicollinearity before model training.
- Feature engineering: Eliminate highly correlated features (>0.9) to reduce dimensionality
- Multicollinearity detection: Identify features that provide duplicate information
- Target correlation: Rank features by correlation with target variable
- Feature interaction discovery: Find features that move together
-
A/B Testing & Experimentation
Determine if test metrics move together or independently.
- Metric correlation: Check if improving metric A hurts metric B (trade-offs)
- Guardrail metrics: Ensure test variations don’t negatively impact key metrics
- Sample ratio mismatch: Detect if test groups are properly randomized
- Sequential testing: Monitor correlation changes over time
-
Scientific Research & Data Analysis
Universal tool for exploring relationships between measured variables.
- Climate science: Temperature vs CO2 levels, rainfall vs humidity
- Medical research: Drug dosage vs patient outcomes, biomarker correlations
- Physics experiments: Sensor data validation, measurement consistency
- Social sciences: Survey response correlations, demographic patterns
-
Time Series Analysis
Detect relationships between time-dependent variables.
- Economic indicators: GDP vs unemployment, interest rates vs inflation
- IoT sensor networks: Temperature correlation across locations
- Website analytics: Traffic patterns vs conversion rates over time
- Supply chain: Demand correlation across product categories
-
Quality Control & Manufacturing
Process optimization through relationship detection.
- Process parameters: Machine temperature vs defect rate
- Predictive maintenance: Sensor readings correlation with failure events
- Production optimization: Speed vs quality trade-offs
- Supply-demand matching: Production volume vs order patterns
-
Marketing & Business Intelligence
Measure relationships between business metrics.
- Ad spend effectiveness: Marketing spend vs revenue across channels
- Customer behavior: Website traffic vs conversions, engagement vs retention
- Social media: Post frequency vs engagement, sentiment vs sales
- Pricing analysis: Price changes vs demand elasticity
-
Environmental & IoT Data
Sensor data correlation for pattern detection and anomaly identification.
- Smart cities: Air quality vs traffic density, noise vs time of day
- Agriculture: Soil moisture vs crop yield, temperature vs growth rate
- Energy management: Usage patterns vs weather conditions
- Building automation: HVAC efficiency vs occupancy patterns
Sources:
- https://docs.scipy.org/doc/scipy/reference/stats.html
- https://en.wikipedia.org/wiki/Pearson_correlation_coefficient
- https://en.wikipedia.org/wiki/Spearman%27s_rank_correlation_coefficient
- https://en.wikipedia.org/wiki/Kendall_rank_correlation_coefficient
- https://www.investopedia.com/terms/c/correlation.asp
- https://statisticsbyjim.com/basics/correlations/